


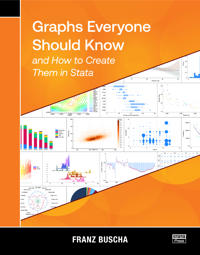

Franz Buscha's book, Graphs Everyone Should Know and How to Create Them in Stata, is written for anyone who uses Stata to make graphs. Beginners will find a complete collection of tools for effectively visualizing their data and results. Experienced Stata users are certain to learn some new tricks as well.
The chapters of the book are organized into four main sections: graphs for univariate data, graphs for bivariate data, graphs for multivariate data, and special graphs. Each chapter introduces a type of graph, explains when and why it is useful for visualizing a particular kind of data, demonstrates how to create that graph using Stata, and shows a few variations. The special graph section covers topics such as how to create maps, plot equations, create animated graphs, and create other specialty graphs.
Readers will find it easy to learn to make graphs by example. Buscha demonstrates most graphs using datasets that are installed with your copy of Stata, so it is straightforward to follow along. He also clearly pairs each graph with the command used to create it in a box just above the graph. If you find a graph that you wish to create with your own data, you can take the command from the box and replace the variable names in the example with your own variable names.
Buscha's book has two unique features that distinguish it from other books about Stata graphs. First, the book's goal is to clearly demonstrate how to effectively visualize different kinds of data and results from models using only necessary features. It focuses on important options but does not discuss all the options available for customizing each graph. Second, the book introduces many community-contributed graph commands that are freely available and can be downloaded from the internet. Readers may be unaware of these commands before finding them in this book, and they can learn how to use them quickly rather than spend time trying to write custom code for themselves.
Graphs Everyone Should Know and How to Create Them in Stata is a reference you will use again and again as you visualize different types of data. You will quickly find the graphs that are applicable to your data and the Stata commands necessary to create them.
Kommentar