


Handlekurven din

Kommentar

Alle bestillinger vil bli brukt USD. Innholdet i din nåværende handlekurv vises CYN, Du vil bruke USD Beregnet med siste valutakurs.

utsolgt

Noen produkter er ikke lenger tilgjengelige. Handlekurven din er oppdatert.

Har du en rabattkode?
Brukte rabattkoder lagres på kontoen din
Delsum
Rabatt

Denne rabattkoden kan ikke brukes i forbindelse med andre kampanjer eller rabatttilbud.

total
Beregn avgifter og fraktkostnader ved betaling.
Gratis levering på alle bestillinger.
NOK

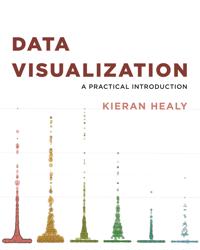
Data Visualization 5957001

Sale price NOK kr302.50 Regular price NOK kr605.00

Ordresammendrag

Data Visualization
302.50
Har du en rabattkode?
Brukte rabattkoder lagres på kontoen din

Delsum
Fraktkostnader beregnes ved kassen.

eller

Kjøpsmetode
Detaljer

An accessible primer on how to create effective graphics from data

This book provides students and researchers a hands-on introduction to the principles and practice of data visualization. It explains what makes some graphs succeed while others fail, how to make high-quality figures from data using powerful and reproducible methods, and how to think about data visualization in an honest and effective way.

Data Visualization builds the reader’s expertise in ggplot2, a versatile visualization library for the R programming language. Through a series of worked examples, this accessible primer then demonstrates how to create plots piece by piece, beginning with summaries of single variables and moving on to more complex graphics. Topics include plotting continuous and categorical variables; layering information on graphics; producing effective “small multiple” plots; grouping, summarizing, and transforming data for plotting; creating maps; working with the output of statistical models; and refining plots to make them more comprehensible.

Effective graphics are essential to communicating ideas and a great way to better understand data. This book provides the practical skills students and practitioners need to visualize quantitative data and get the most out of their research findings.

  • Provides hands-on instruction using R and ggplot2
  • Shows how the “tidyverse” of data analysis tools makes working with R easier and more consistent
  • Includes a library of data sets, code, and functions

    Se alle detaljene
    Autentisering
    Hvis du ikke har en konto, klikker du på Opprett konto.bli medlem